
I kept gaining and losing the same 8 pounds for almost two years before I figured out the scale was lying to me. My waist dropped from 34 to 31 inches and my chest grew by 2 inches, while the needle barely moved. That was the day I built my first body measurement tracking sheet. Six months later, I had a clear visual record of exactly what my body was doing, and I have never trusted a number on the scale the same way since.
If you want to track body measurements in a way that actually shows trends, this guide walks you through the full setup. You will learn which body parts to measure, how to take measurements without messing up the data, how to build a body measurement spreadsheet in Google Sheets or Excel, and how to turn those numbers into trend charts that make progress obvious. By the end, you will have a working body measurement tracking sheet and a clear plan to keep it useful for the long haul.
Table of Contents
- What Is a Body Measurement Tracking Sheet and Why It Matters
- Body Parts to Track for a Complete Measurement Chart
- How to Take Body Measurements Correctly
- Setting Up Your Tracking Sheet in Google Sheets or Excel
- Creating Trend Visualization That Actually Shows Progress
- Tips for Long-Term Tracking Success
- Frequently Asked Questions
- Final Thoughts on Building a Body Measurement Tracking Sheet
What Is a Body Measurement Tracking Sheet and Why It Matters
A body measurement tracking sheet is a structured log, usually a spreadsheet, that records circumferences of specific body parts at regular intervals so you can see how your shape changes over time. The scale only tells you your total mass. A measurement chart tells you where the change is actually happening.
This matters because body recomposition is real. I have personally watched the scale hold steady while my waist dropped an inch and my shoulders added a half inch. Reddit’s r/Fitness and r/loseit communities are full of similar stories. People lose fat and gain muscle at the same time, and the scale pretends nothing happened. A body measurement log captures the change the scale cannot.
Measurements also expose problems the scale hides. If your waist is climbing while your weight is flat, you are gaining fat even if the number looks fine. If your thigh measurement is dropping while your weight is unchanged, you are losing muscle you wanted to keep. Without a body measurement chart, you are guessing.
Tracking also forces honesty. Our memories are terrible with gradual change. We look in the mirror every day and adjust our reference point. A measurement tracker resets the comparison to actual numbers, recorded on actual dates, with no memory bias built in.
Body Parts to Track for a Complete Measurement Chart
The right set of measurements is the foundation of a useful tracking sheet. Measure too few and you miss changes. Measure too many and you burn out within three weeks. After testing more than a dozen combinations, here is the set I recommend starting with.
Essential Measurements (Start Here)
- Neck – Below the larynx, tape level. Catches upper-body fat loss early.
- Chest – Across the nipples for men, across the fullest part for women. Tracks upper-body muscle growth.
- Waist – One inch above the navel, belly relaxed. The single most important health marker.
- Hips – Widest point around the seat. Critical for tracking lower-body changes.
- Thigh – Midpoint between hip crease and back of knee. Track left and right separately for accuracy.
- Upper arm – Midpoint between shoulder and elbow, relaxed. Responds quickly to training changes.
Optional But Useful Measurements
- Forearm – Especially helpful if you lift heavy on arms.
- Calf – One of the slowest-changing spots, useful for long-term tracking.
- Shoulders – Around the widest point of the delts.
- Lower thigh – Just above the knee, useful for physique athletes.
Should You Track Left and Right Separately?
Yes, for arms and thighs. Most people have a dominant side that is roughly 0.25 to 0.5 inches bigger. If you only measure one side, you might think your arm shrunk when it was just a measurement angle shift. Tracking both sides separately lets you average them and spot asymmetries. For waist, hips, chest, and neck, left-right tracking is not needed because the measurement is symmetric by nature.
Digital vs Paper Tracking
Both work, but they serve different people. I started with a printable body measurement chart taped to the inside of a closet door. When I started wanting trend lines, I moved to a Google Sheets body measurement tracker. Here is the honest comparison.
- Paper tracking – Free, no learning curve, easy to fill in. But no automatic charts, easy to lose, no formula power, and it gets hard to read after 8 weeks of entries.
- Spreadsheet tracking (Google Sheets or Excel) – Free, automatic charts, easy formulas, accessible from any device. Takes 30 minutes to set up the first time.
- Dedicated apps – Convenient, automatic trend lines, sync to Apple Health. But locked into a specific look, often paid for full features, harder to customize.
If you want trends without subscriptions, the spreadsheet wins. That is what we are building next.
How to Take Body Measurements Correctly
Bad measurements are worse than no measurements. If the tape is in a different spot every week, your trend line is measuring your inconsistency, not your body. Here is the technique I have used for over 200 measurement sessions.
Step 1: Use the Same Tape Measure Every Time
Buy one soft cloth or vinyl tape measure and use it forever. Different tapes can vary by 0.25 inches. The $5 tape from your local pharmacy is fine. Mark it with your initials so no one else grabs it.
Step 2: Measure at the Same Time of Day
First thing in the morning, after using the bathroom, before eating. Your waist can vary by 1 to 2 inches between morning and night due to food, water, and bloating. If you measure at random times, your data will be noisy. Pick a window and stick to it. I take mine every Sunday at 7 a.m. before breakfast.
Step 3: Keep the Tape Level and Snug, Not Tight
The tape should touch the skin all the way around without compressing it. If you are pulling the tape so hard it dimples the skin, you are squeezing out fat and getting a false low number. Breath normally. Do not suck in.
Step 4: Measure Twice and Average
Especially when you are starting out. Take the measurement, release the tape, measure again. If the two numbers are within 0.25 inches, write down the average. If they are off by more, take a third reading. This single habit saved my data from being garbage for the first month.
Step 5: Stand the Same Way Every Time
Feet together, arms relaxed at your sides, looking straight ahead. Posture can shift the waist and chest by half an inch. Stand in front of a mirror the first few times to verify your tape is level.
Warning: Never measure right after a heavy workout, a large meal, or a high-sodium day. The numbers will look worse than they are and can wreck your motivation. If you forget and measure at the wrong time, mark the entry with an asterisk in your sheet so you remember to interpret it carefully.
How Often Should You Measure?
Weekly is the sweet spot for most people. Daily is too noisy – the trend is hidden under day-to-day water swings. Monthly is too sparse – you miss the moment when a trend actually changes direction. I weigh myself daily and measure weekly. Many r/loseit users report the same rhythm works best.
Setting Up Your Tracking Sheet in Google Sheets or Excel
This is the part most guides skip. We are going to build a real body measurement spreadsheet with formulas that automatically calculate your trend. The exact steps work in both Google Sheets and Excel.
Step 1: Create the Column Headers
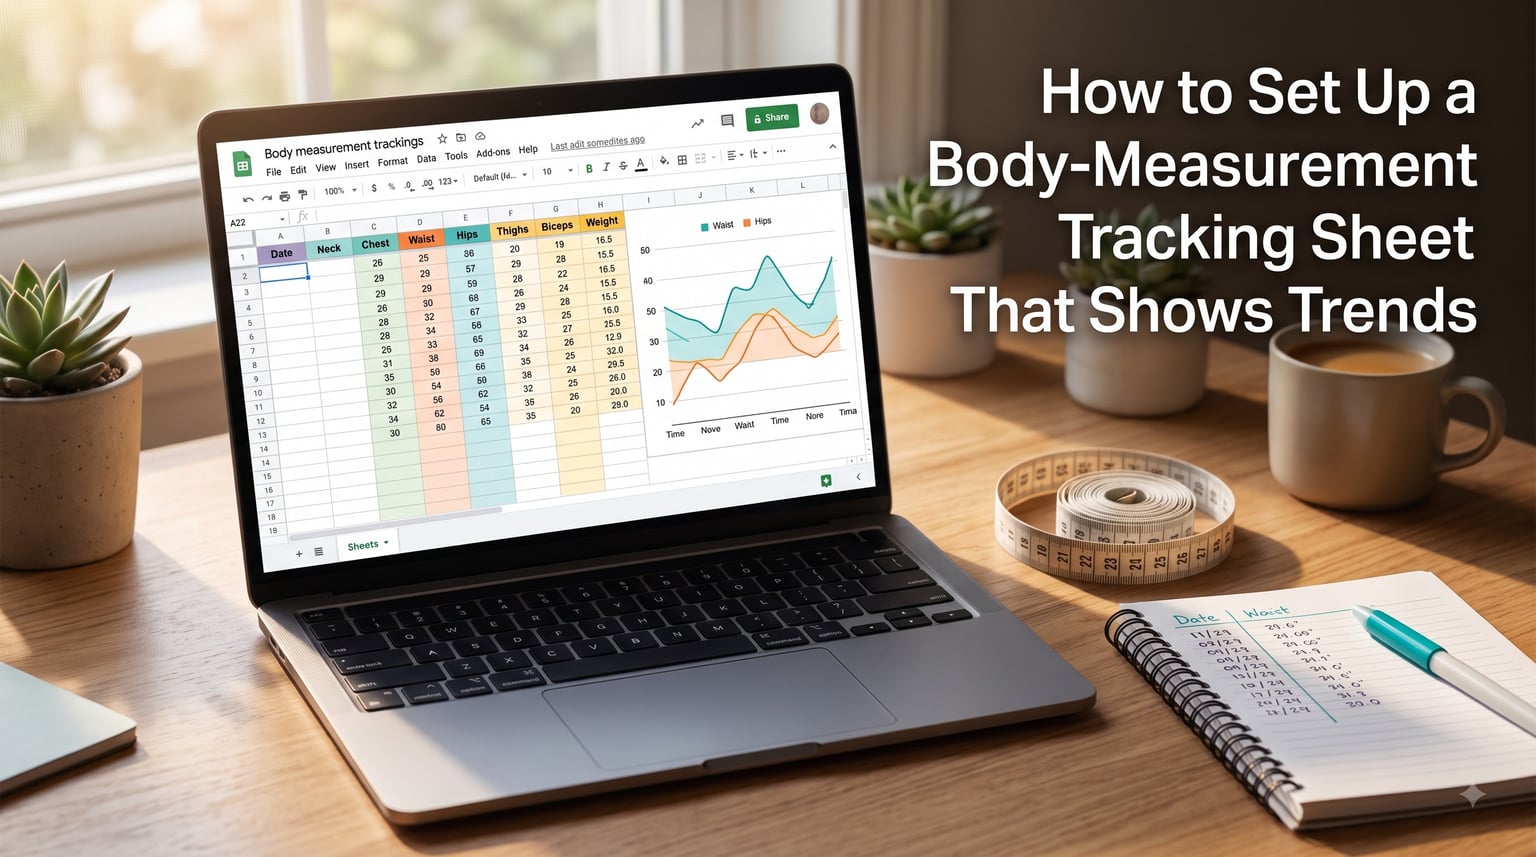
Open a new spreadsheet. In row 1, create the following columns from left to right.
- A: Date
- B: Weight (lbs)
- C: Neck (in)
- D: Chest (in)
- E: Waist (in)
- F: Hips (in)
- G: Thigh Left (in)
- H: Thigh Right (in)
- I: Arm Left (in)
- J: Arm Right (in)
- K: Notes
Freeze row 1 so the headers stay visible when you scroll. In Google Sheets, click View, Freeze, 1 Row. In Excel, click View, Freeze Panes, Freeze Top Row.
Step 2: Format the Date Column
Select column A and format it as Date. This lets you sort and filter your entries cleanly. Add the first row as your starting measurement date. Every Sunday after that, add a new row.
Step 3: Add a Starting Row of Formulas
Skip a few rows down. In row 5, build a “Change Since First Measurement” calculator. In cell A5, type “Change Since Start.” Then in B5, type =B2-B2 (this will return 0 the first time). In C5, type =C2-C2. Continue this pattern for each measurement column. These formulas will update automatically as you add new data.
Better still, in row 6, add a “Trend Over Last 4 Weeks” formula. In cell B6, type =AVERAGE(INDEX(B:B,COUNTA(B:B)-3):INDEX(B:B,COUNTA(B:B)))-AVERAGE(INDEX(B:B,COUNTA(B:B)-7):INDEX(B:B,COUNTA(B:B)-4)). This compares your last 4 weeks to the 4 weeks before that. A negative number means your waist is trending down. A positive number on chest or arm means growth.
Step 4: Add a Waist-to-Hip Ratio Calculator
In cell L1, type “Waist-to-Hip Ratio.” In cell L2, type =E2/F2. This single number is one of the strongest health markers you can track. A ratio above 0.90 for men or 0.85 for women signals elevated visceral fat risk. As you track, you will see this ratio drop months before the scale moves.
Step 5: Build a Copy-Paste Table You Can Reuse
Here is a starter block you can paste into any new sheet. Replace the example values with your own measurements from your first session.
- Date: First Sunday of the Month
- Weight: 175 lbs
- Neck: 15.0 in
- Chest: 40.0 in
- Waist: 34.0 in
- Hips: 38.0 in
- Thigh Left: 22.0 in
- Thigh Right: 22.25 in
- Arm Left: 13.5 in
- Arm Right: 13.75 in
Step 6: Add Conditional Formatting
Highlight column E (waist). Apply conditional formatting: if the value is greater than the previous row, light red. If less, light green. This gives you an at-a-glance sense of direction without even reading the numbers. Repeat for chest and arm columns but flip the colors (green for up, red for down if you are trying to build muscle there).
Creating Trend Visualization That Actually Shows Progress
Numbers in cells are fine. Charts are where the magic happens. A trend line is the single most motivating feature of any body measurement tracking sheet. Here is how to set one up.
Step 1: Select Your Data
Highlight column A (Date) and column E (Waist). Hold Ctrl or Cmd to also highlight column D (Chest) and column I (Arm Right). You should now have four columns selected, all with their header row included.
Step 2: Insert a Line Chart
In Google Sheets, click Insert, Chart. In the Chart Editor on the right, change the chart type to Line Chart. In Excel, click Insert, Charts, Line, Line with Markers. A line chart gives you the trend far more clearly than a bar chart because it emphasizes the slope between data points.
Step 3: Add a Trend Line
Click the chart, then click the three dots menu and choose Edit Chart. Go to the Customize tab, expand Series, and check Trendline. Pick Linear for steady change or Moving Average for a smoother curve that filters out noise. Pick a 4-week moving average if you measure weekly. It smooths out measurement errors and shows the underlying trend.
Step 4: Build a Sparkline for Each Row
Sparklines are tiny in-cell charts that show the trend of the last few data points. In Google Sheets, type =SPARKLINE(E2:E10) in an empty cell. The result is a tiny line graph inside the cell. Drag this formula down to repeat for every measurement. You will see your entire history visualized at once. This is the technique I credit most for keeping me consistent for 18 months.
How to Read Trend Lines Correctly
Look at the slope, not the noise. Individual weekly measurements will bounce around. The trend line smooths these out. If the trend line for your waist is pointing down over 4 to 8 weeks, your body is changing even if a single week’s number looks worse than the last one. Do not overreact to a single bad week. I have learned the hard way to wait for at least 4 data points before drawing conclusions.
What to Look For in the First 12 Weeks
- Healthy fat loss: Waist trending down, weight trending down, neck and chest stable or slightly increasing.
- Muscle gain: Chest, arms, and thighs trending up, weight up by 1 to 2 pounds per month, waist stable or slightly down.
- Warning sign: Waist trending up while weight is flat, or thigh measurement dropping while chest holds steady. Adjust your plan.
- Plateau: All measurements flat for 4+ weeks. Time to change something in your training or nutrition.
Tips for Long-Term Tracking Success
A tracking sheet only works if you keep using it. Here are the habits that separate people who get 12 weeks of data from people who get 12 months.
Pick a Non-Negotiable Day and Time
Sunday at 7 a.m. works for me. Pick one that fits your schedule and treat it like an appointment. Set a recurring phone reminder. Block 10 minutes on your calendar. The first 4 weeks are the hardest. After that, it becomes part of your routine.
Track on the Same Surface Each Time
Carpet compresses. Tile does not. If you measure over carpet sometimes and hard floor other times, your waist measurement can shift by 0.25 inches. Stand on the same spot every time.
Do Not Adjust the Data
If a number looks off, write it down anyway. Adjusting measurements to “make the trend look better” defeats the purpose. Use the Notes column to flag weird entries. Your future self will thank you.
Pair with Progress Photos
Monthly front, side, and back photos under the same lighting give you a visual record that complements the numbers. Many r/loseit users say it is the photo, not the chart, that keeps them motivated during plateaus.
Review Trends Monthly, Not Weekly
Weekly review gives you anxiety. Monthly review gives you strategy. Pick one day each month to look at your trend lines and ask: is my plan working. Trends are the steering wheel. Daily numbers are the rearview mirror.
Common Mistakes to Avoid
- Measuring at different times of day and blaming the inconsistency on your body.
- Changing the tape position every week.
- Stopping after 3 weeks because “nothing is happening.”
- Trusting the scale over the waist measurement.
- Tracking too many body parts and burning out by week 4.
Frequently Asked Questions
How do I create a template for body measurements?
Open a spreadsheet and create columns for Date, Weight, Neck, Chest, Waist, Hips, Thigh Left, Thigh Right, Arm Left, Arm Right, and Notes. Freeze the header row, format the date column, and add a Waist-to-Hip Ratio formula in cell L2. Your first body measurement template is ready in under 10 minutes.
How often should I take body measurements?
Weekly is the best frequency for most people. Daily measurements are too noisy due to water retention and food intake. Monthly is too sparse and you will miss important trend changes. Measure every 7 days at the same time of day, ideally first thing in the morning before eating.
How do I track body composition changes?
Track waist, hips, chest, arms, and thighs weekly using a soft tape measure. Calculate waist-to-hip ratio by dividing waist by hips. Add a trend line chart in your spreadsheet to visualize the slope. Combine measurements with monthly progress photos for a complete picture of body composition changes.
How do I take body measurements correctly?
Use a soft tape measure, stand with feet together, and keep the tape level. Pull the tape snug without compressing the skin. Measure at the same time of day each session, ideally mornings before eating. Repeat each measurement twice and average the results for accuracy.
Is there an app to track body measurements?
Yes. Apps like My Body Measurement Tracker, Body Diary, and similar options sync to Apple Health and Google Fit. However, a Google Sheets or Excel body measurement tracker gives you full control, free trend lines, and customizable formulas without a subscription.
Which is better for tracking: Excel or Google Sheets?
Both work well. Google Sheets is free, syncs across devices automatically, and handles trend lines easily. Excel has stronger formulas but requires a paid license. For most people tracking body measurements, Google Sheets is the better choice because it is free, accessible anywhere, and easy to share with a coach or accountability partner.
Final Thoughts on Building a Body Measurement Tracking Sheet
A body measurement tracking sheet is one of the most underrated tools in any fitness journey. It shows you what the scale hides, exposes trends weeks before they are visible in the mirror, and turns subjective changes into objective data you can act on. The setup takes 30 minutes. The habit payoff lasts years.
Start small. Pick six body parts, measure once a week, and log the numbers in a simple spreadsheet. Add a trend line after your third entry. By week 8, you will have a visual story of how your body is responding. That is when the tracking sheet becomes more than a log. It becomes the clearest feedback loop you have.
Open a new Google Sheet, type today’s date in row 2, and take your first measurement. Set a weekly reminder for the same time each week. The hardest part is the first month. After that, the data does the work, and you just have to keep showing up.